What is the Where You Work Matters List?
The Where You Work Matters List is an unprecedented, independent rating of how well the largest U.S. employers are creating high-quality jobs. The List provides businesses with critical insight to drive business performance and individual employee growth, and it provides workers and job seekers with essential data to make informed decisions in a rapidly transforming labor market. For more information about the List, see the About page.
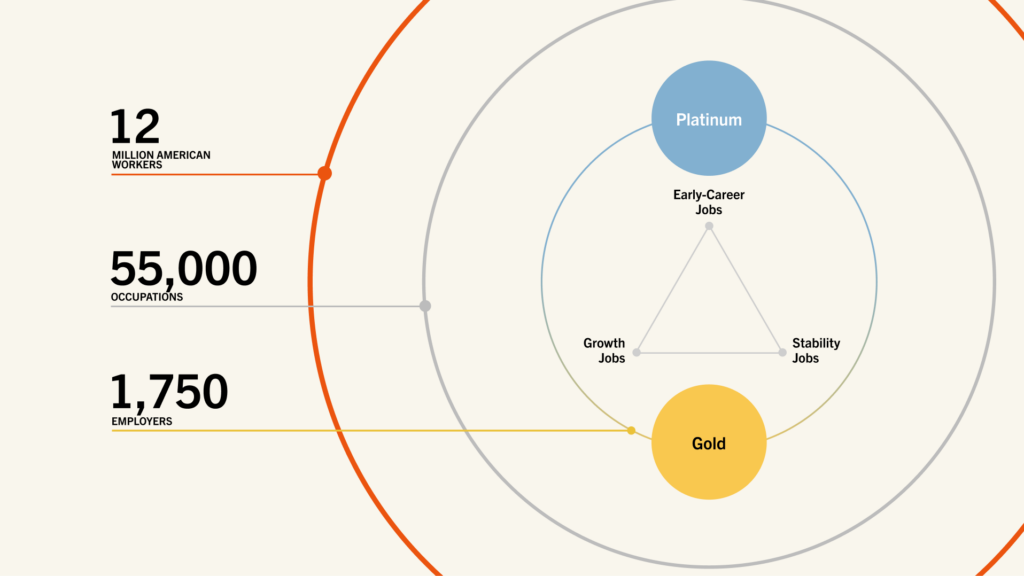
The List recognizes the employers doing the best in advancing, paying and retaining their workers. High-performing firms are identified as gold employers, and the very best ones are badged as platinum employers.
The List recognizes three ways employers can create good jobs: Early Career jobs, which are open to entry-level workers and provide skills and training for internal or external advancement; Growth jobs, which provide opportunities to rise internally and externally, especially in firms where leaders rise internally, and Stability jobs, which provide leading pay and retention.
How is the List assembled?
We assess the progress of a company’s employees predominantly from 2019 to 2024, using a range of data sources, including profiles and resumes they uploaded to career sites such as LinkedIn, pay data from sites such as Glassdoor, and job-postings data from Lightcast. Unlike most other measures that seek to identify best places to work, the List does not rely upon data provided or self-reported by companies. Instead, it is based on observed employee outcomes. This is a project in the public interest. There is no pay for play, and companies cannot choose to opt out of the List.
Which companies are included?
We assess the U.S.-based workforce of 1,750 employers, including publicly traded firms, private employers and nonprofit organizations. In total, we observe about 12 million U.S. workers. We do not assess federal, state or local governments, nor do we assess the U.S. military. We include employers for which we have statistically significant data and have excluded firms that have ceased operating independently due to mergers, acquisitions, discontinued operations, or split-ups. Companies that continue to operate independently that have experienced significant corporate events (e.g., bankruptcy, mergers) that may materially impact go-forward performance are included in the list, with a clear flag indicating the nature of the event.
What do we measure?
The Where You Work Matters List measures the career progression of workers across all occupations at assessed employers for which there is sufficient data. We measure career progression using six key metrics:
- Internal Promotion: What’s the likelihood of being promoted at least once within five years of starting in a new role at the company?
- Advancement Beyond: What’s the likelihood of moving to another employer for a different job with better compensation within five years?
- Wage: How well are workers paid compared to others in the same occupation at other employers?
- Retention: What share of employees stay with the employer for at least three years?
- Entry Level: How many people in an occupation at a company were hired with less than three years of experience?
- Leaders From Within: What percentage of a company’s most-highly paid personnel rose through the ranks into those jobs?
How do we use those metrics to assess employers?
The List is grounded in a belief that employers can create good jobs in three ways:
- Early Career jobs, which are open to entry-level workers and provide skills and training for internal or external advancement.
- Growth jobs, which provide opportunities to rise internally and externally, especially in firms where leaders rise internally.
- Stability jobs, which provide leading pay and retention.
We assess employer performance in each of the three good-jobs archetypes, using a different mix of metrics.
- Early Career jobs are based on performance in the Internal Promotion and Advancement Beyond metrics, but only if at least 20 percent of hires in that occupation at an employer are Entry Level workers.
- Growth Jobs are based on performance in the Internal Promotion and Advancement Beyond metrics, with a company-level bonus applied at firms with high Leaders From Within scores.
- Stability Jobs are based on performance in the Wage and Retention metrics.
How are occupations rated?
We begin by looking at all employees at each company for whom we can find sufficient external data. We then group those workers by occupation, using the Department of Labor’s O*NET taxonomy. Then, we identify the occupations at companies for which we have statistically significant pools of employee data. Those workers are included in our assessment. If we do not have enough employee data to measure an occupation at a company, we will exclude that occupation. In order to assess a firm, we require measurable data for enough occupations to represent at least half of the company’s workforce, based on statistical models of the company’s workforce developed by the Burning Glass Institute.
We assess each occupation using the six metrics listed above, calculating each metric for every occupation at each company. We then benchmark each occupation–metric value against the distribution for that same occupation and metric across all companies (e.g., retention for customer service representatives). To standardize assessments and enable comparability, we convert these benchmarked values into z-scores, which express performance in terms of standard-deviations relative to peer companies.
We use metric scores by occupation to determine how well an occupation at a company performs in each of the three archetypes listed above. In general, if the score is at the 80th percentile or higher, that occupation at a company is rated as platinum for the archetype. If the score is between the 60th and 80th percentiles, that occupation at a company is rated gold for the archetype.
How are the three archetype badges awarded?
Company-level archetype badges are based on the number of occupations that are assessed as platinum and gold at a company, and the percentage of workers at that firm in those occupations.
We begin by scoring each occupational badge. Platinum badges are assigned 1.6 points, and Gold badges are assigned 1.2 points.
We then weight each occupation based on the prevalence of that occupation at a company, as inferred from job postings and worker career histories. If a company has more customer-service representatives than administrative assistants, for example, the customer-service representatives receive greater weighting when calculating a company’s total overall performance by archetype.
The top fifth of firms in each archetype are awarded platinum badges; those in the next fifth are awarded gold badges.
How are overall badges awarded?
Once we have constructed archetype badges and scores, we take a weighted average of the company-level scores across the three archetypes (with 0.75 weightings applied to the Early Career and Growth archetype to account for the overlapping metrics applied within these archetypes) to form an overall score for each company. The top fifth of firms are awarded platinum badges; those in the next fifth are awarded gold badges.
What might the List miss?
Online career histories are self-reported, which can yield embellishments and inaccuracies, but our analysis also suggests that any that might occur are equally likely across firms. There is no reason to believe that Walmart’s employees are any more likely to misrepresent career progress than their counterparts at Target, for instance.
Further, this is a complex exercise involving multiple hard-to-account-for variables. Even the extensive data-driven analysis used to create the Index cannot account for every nuance that shapes real-world worker outcomes and opportunities. Geography may limit workers’ job choices, for example. Very short stints may go underreported on résumés and in online career profiles. Pursuit of additional education or skill development outside of the workplace is not measured.
On the employer side, companies that rely extensively on contract employees may perform better than they otherwise might if these contractors were considered employees. We present our methodology with humility, aware of certain limitations yet certain that the core strengths of the analysis will make it useful to business leaders and employees.
How has the List changed from last year?
The List is an evolution of the American Opportunity Index, but it employs the same data collection and analysis that have been used to assemble the Index in its first three years. Last year, the Index assessed about 400 companies, ranking the top 100. We believe the transition to ratings and the new three good-job archetypes, which are based on several of the metrics used in over the past three years, will be easier for businesses and their workers to understand and use.
Where can I find data from previous releases of the American Opportunity Index?
For additional information about the 2024, 2023 and 2022 Index, please see below:
Want to go deeper?
For additional detail on the metrics and archetypes behind the List, download the 2026 Where You Work Matters Methodology Supplement.